January 2024
Hotel $86.0Market $84.3RGI 107.8
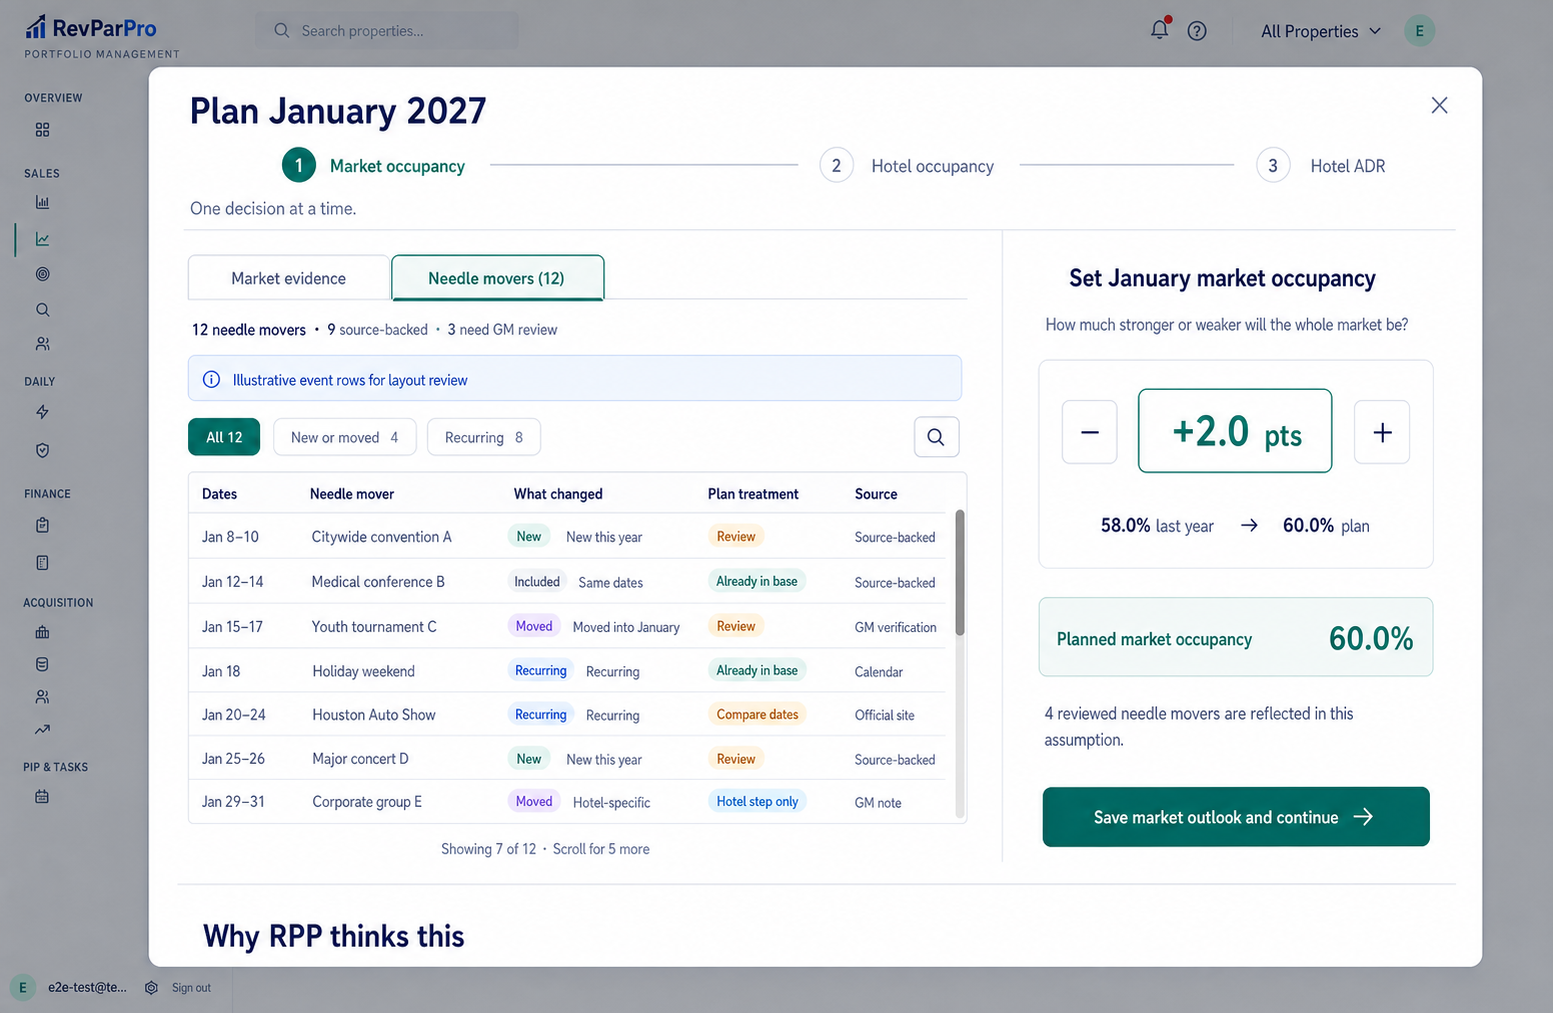
January is built through three focused decisions: market occupancy, hotel occupancy, and hotel ADR. Each assumption gets its own step, its own evidence, and one clear save-and-continue action.
Events live in a fixed-height table rather than the page flow. Filters, a visible scrollbar, and compact rows let the GM review a dozen or more needle movers while the market-occupancy decision stays pinned on the right.
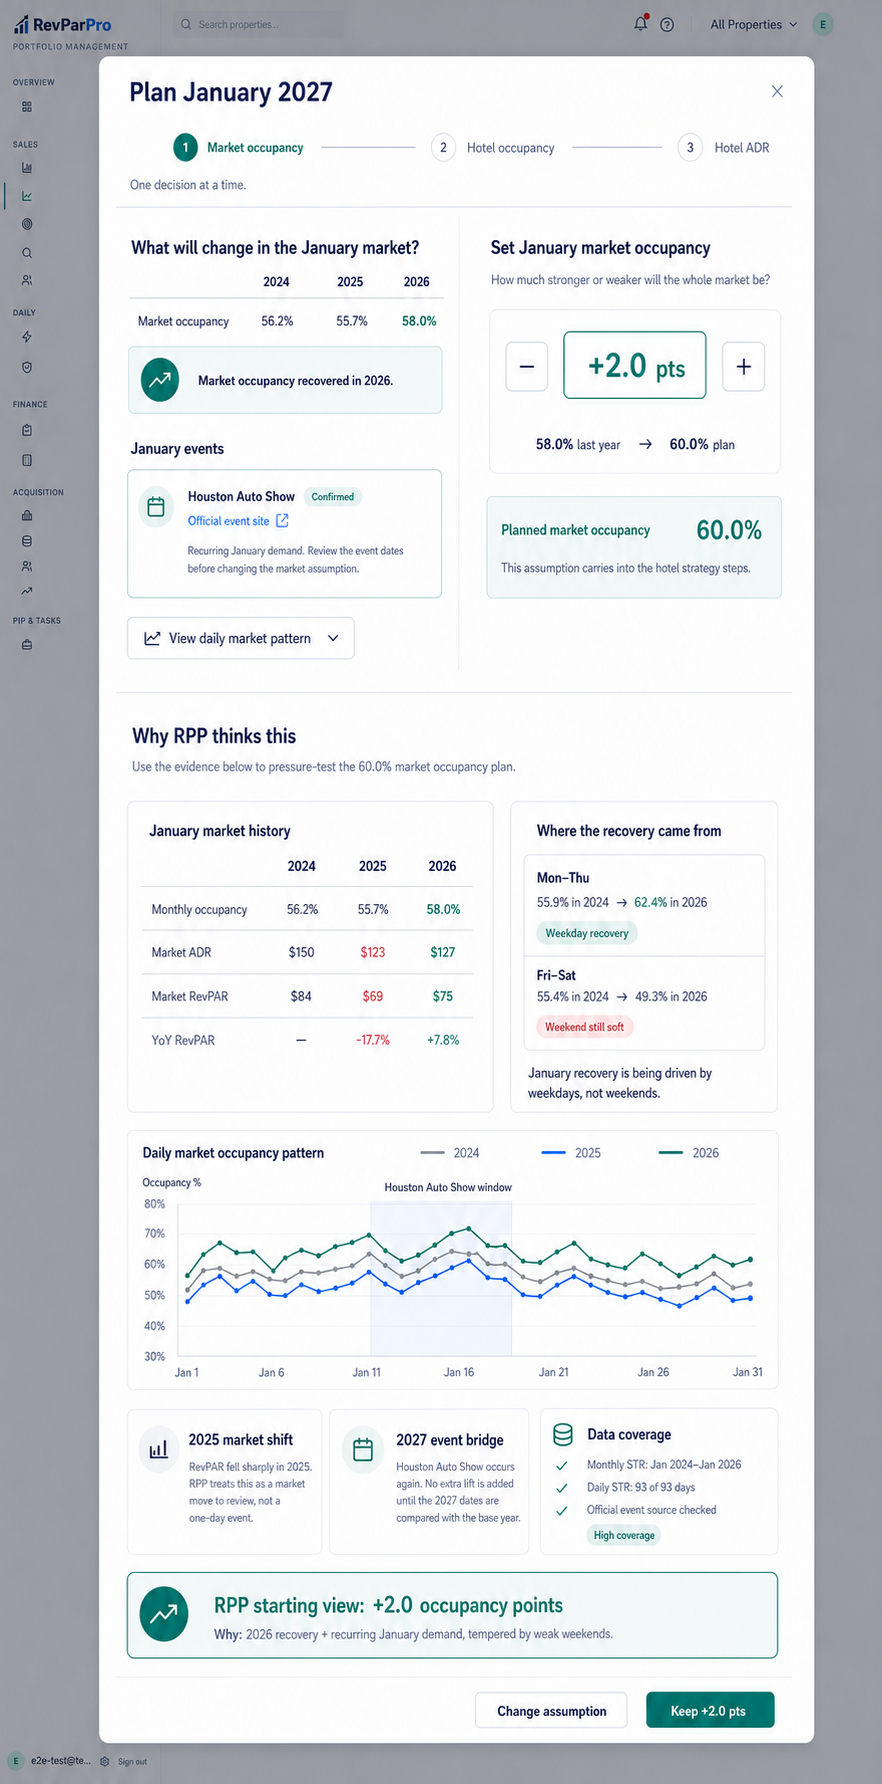
The top stays simple: market history, January events, and one occupancy decision. Scrolling down reveals the daily patterns, rate and RevPAR history, event bridge, anomaly treatment, and data coverage behind RPP's starting view.
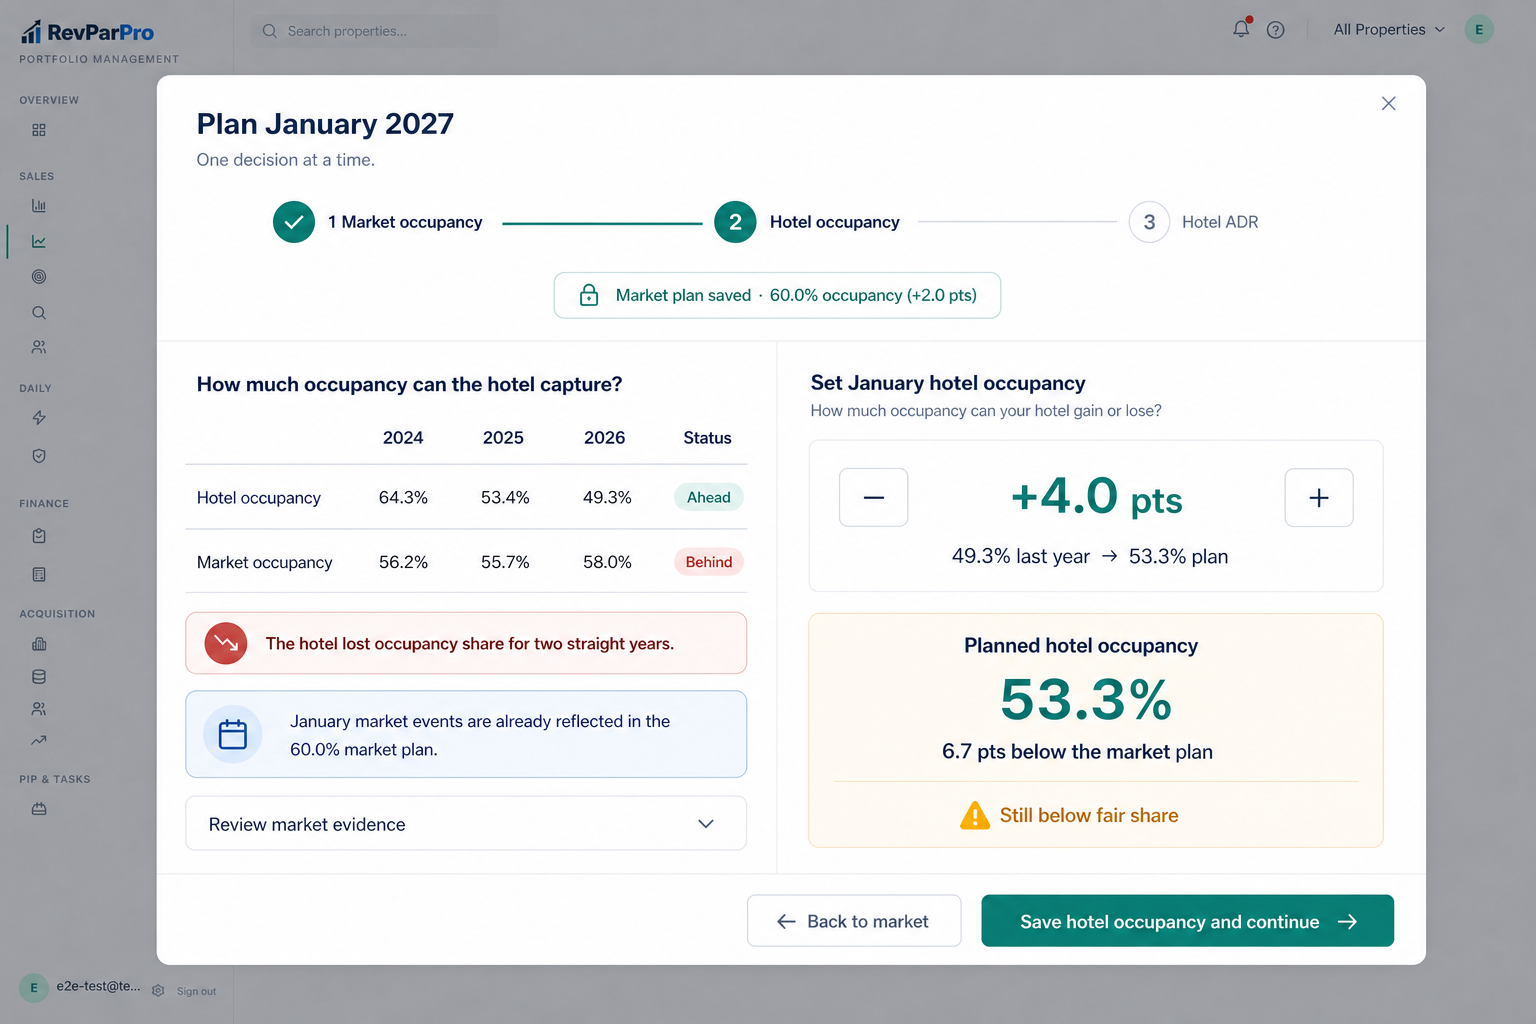
Carry forward the saved market plan, show how the hotel has captured occupancy historically, and let the GM set only the hotel occupancy change.
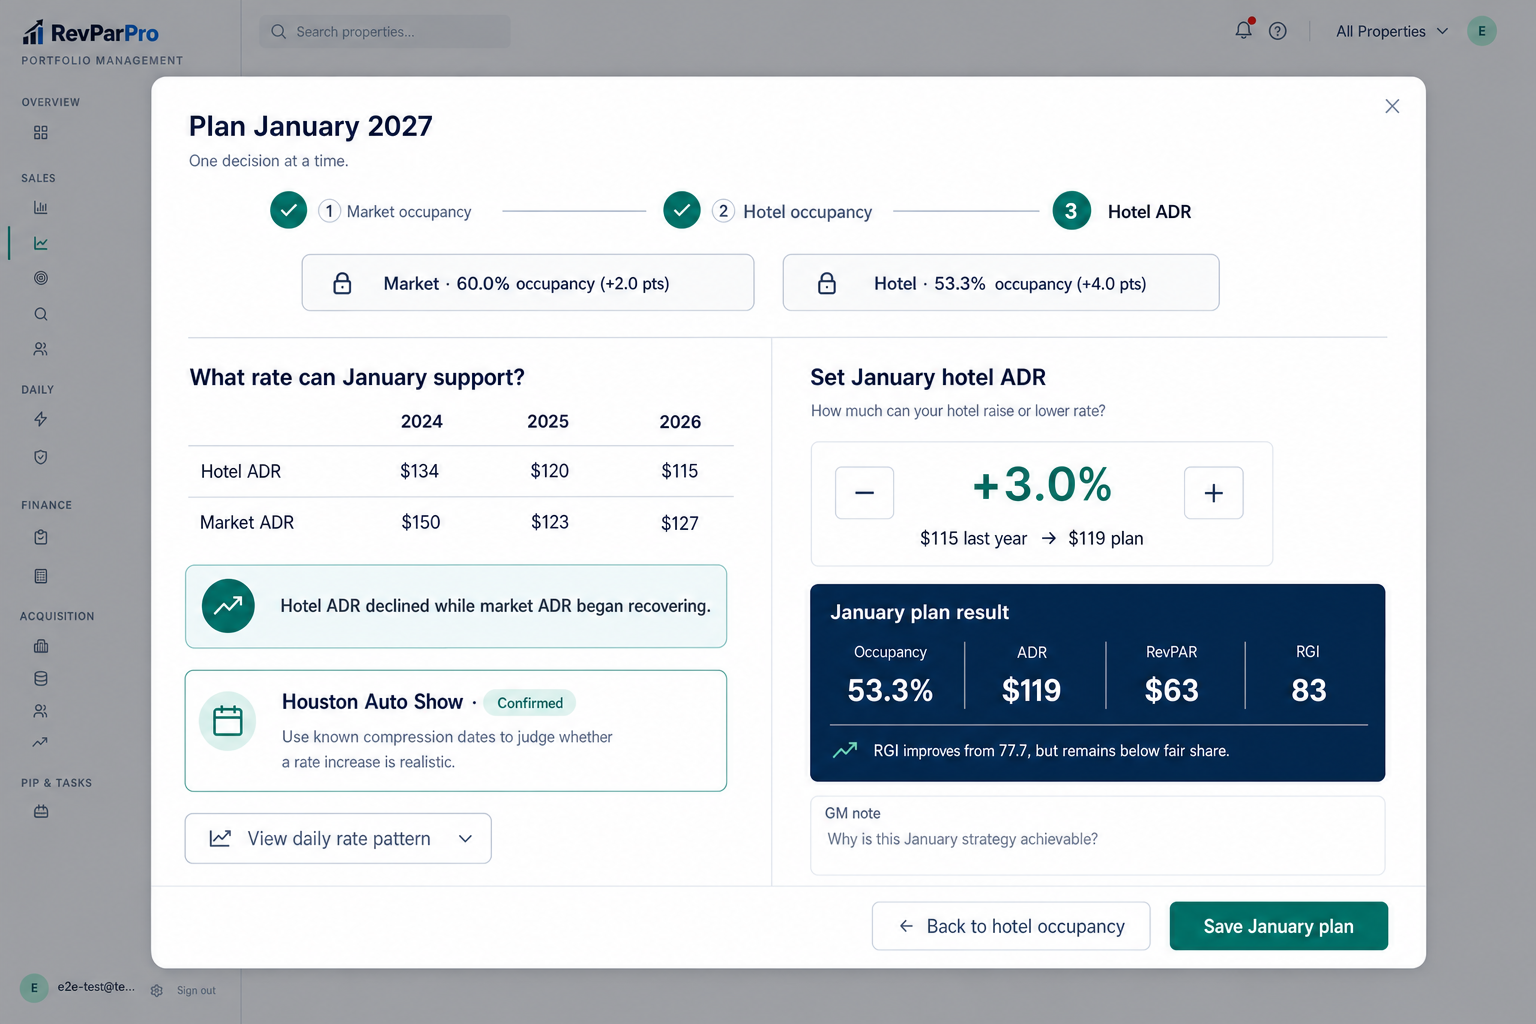
Carry forward both occupancy decisions, show the rate evidence and known events, then set hotel ADR and reveal the completed January result.
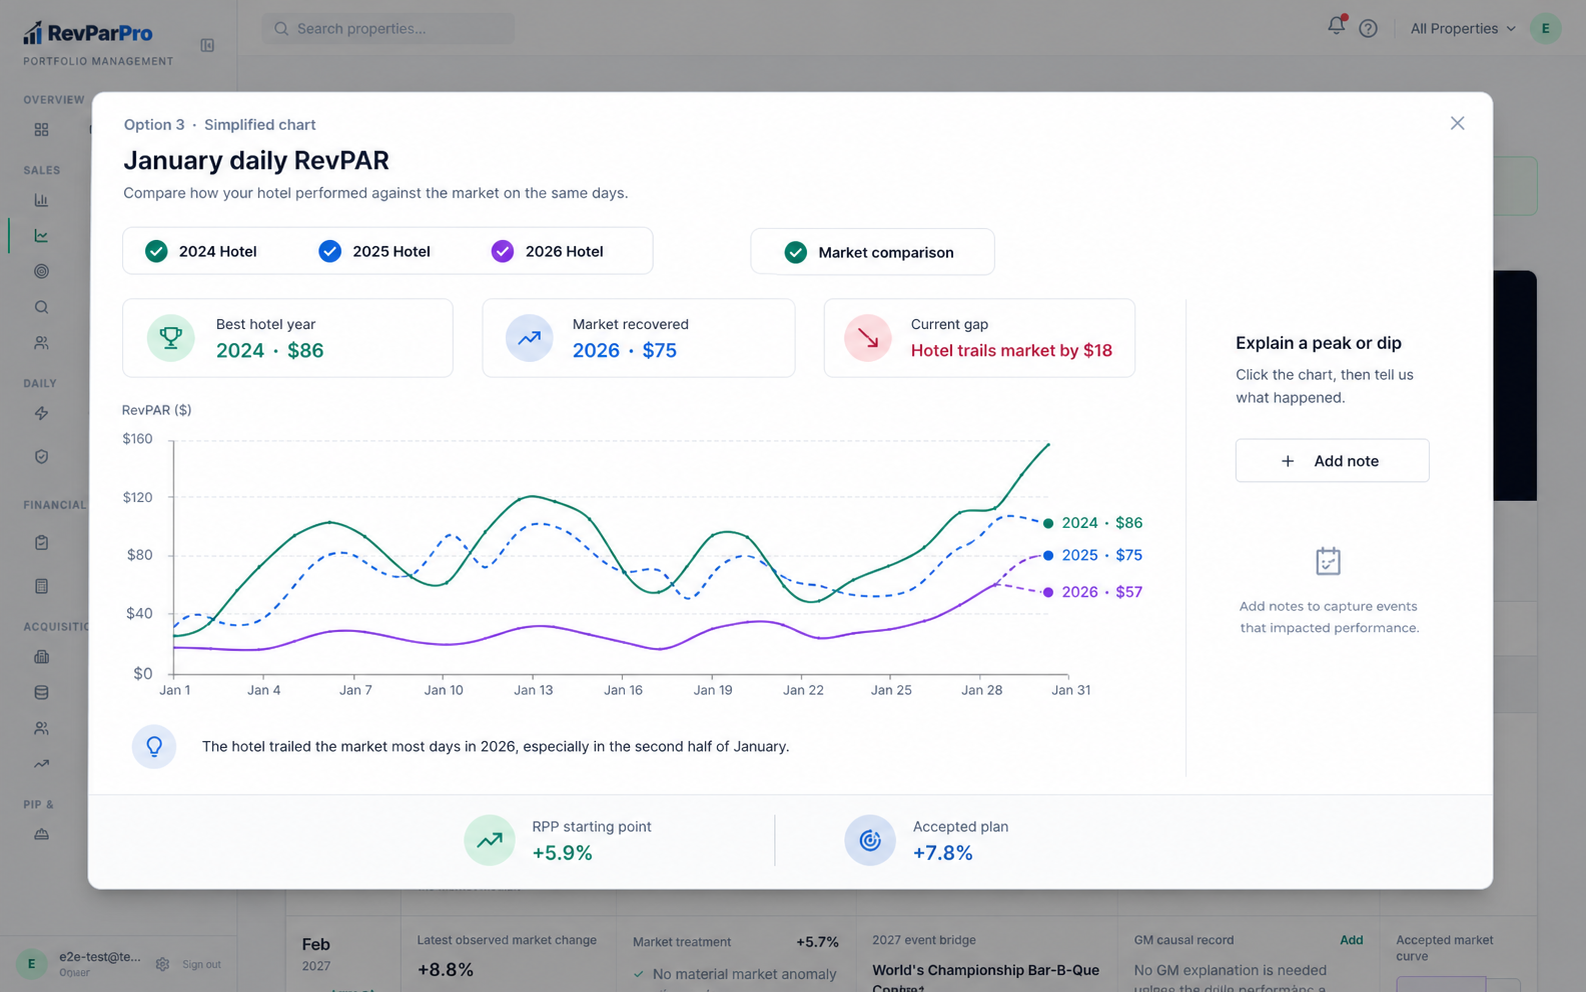
This version put all three controls on one screen. It is retained only to show the direction that was rejected in favor of one decision per step.
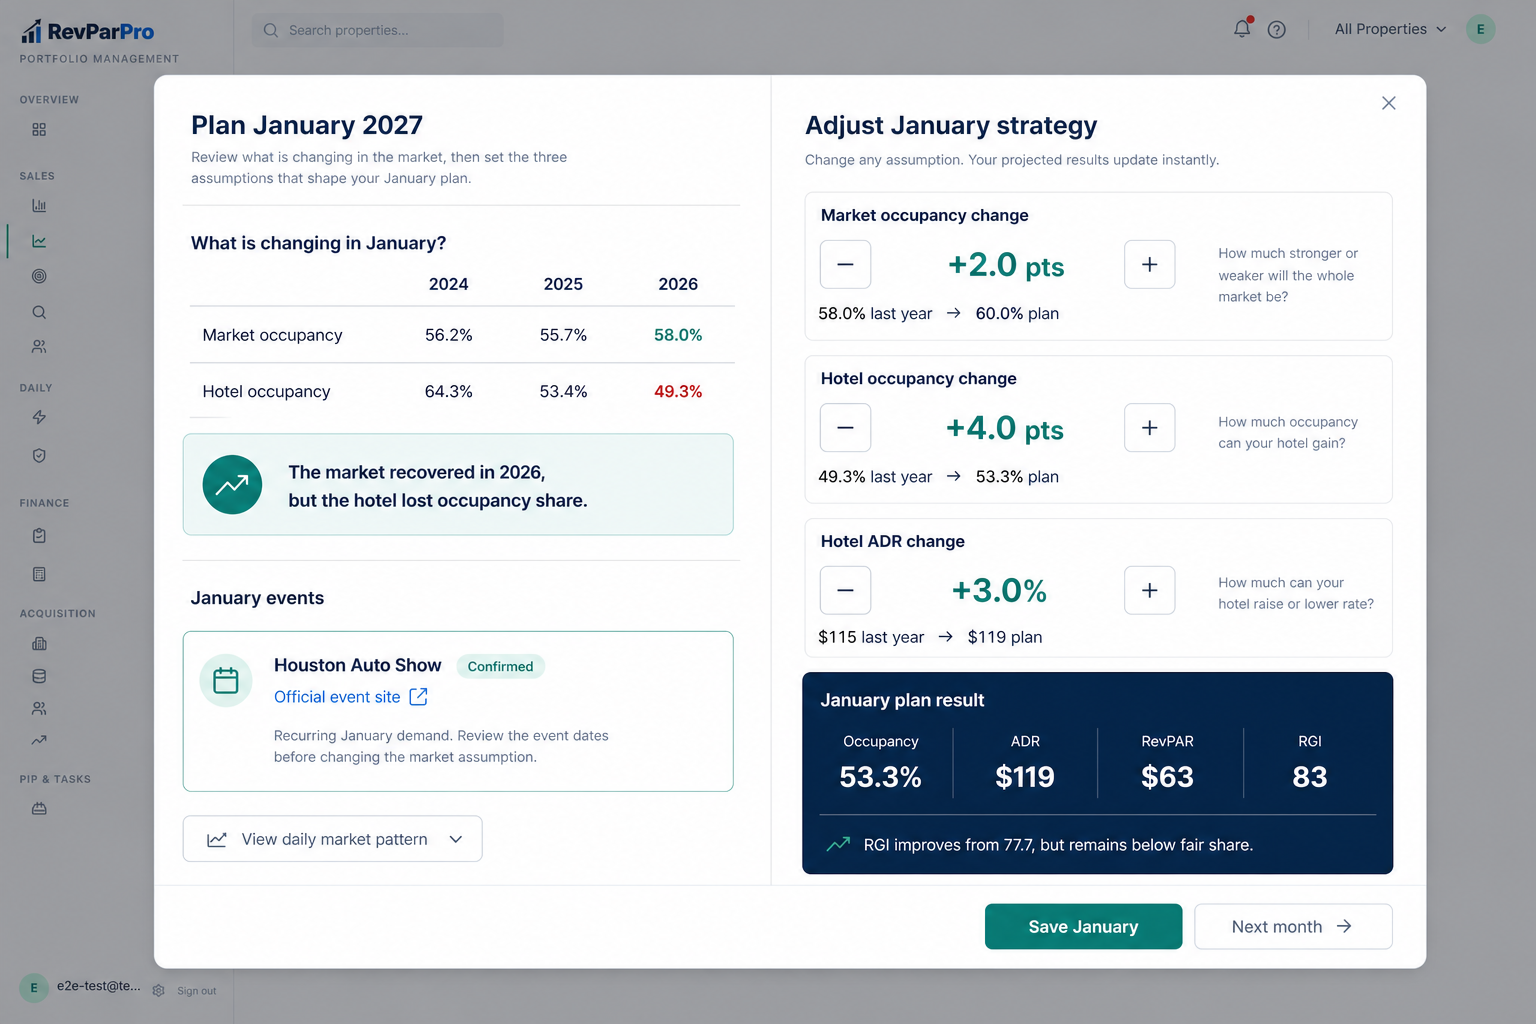
Starts with the conclusion, but does not give the GM the three strategy levers. Retained only to show the discarded direction.
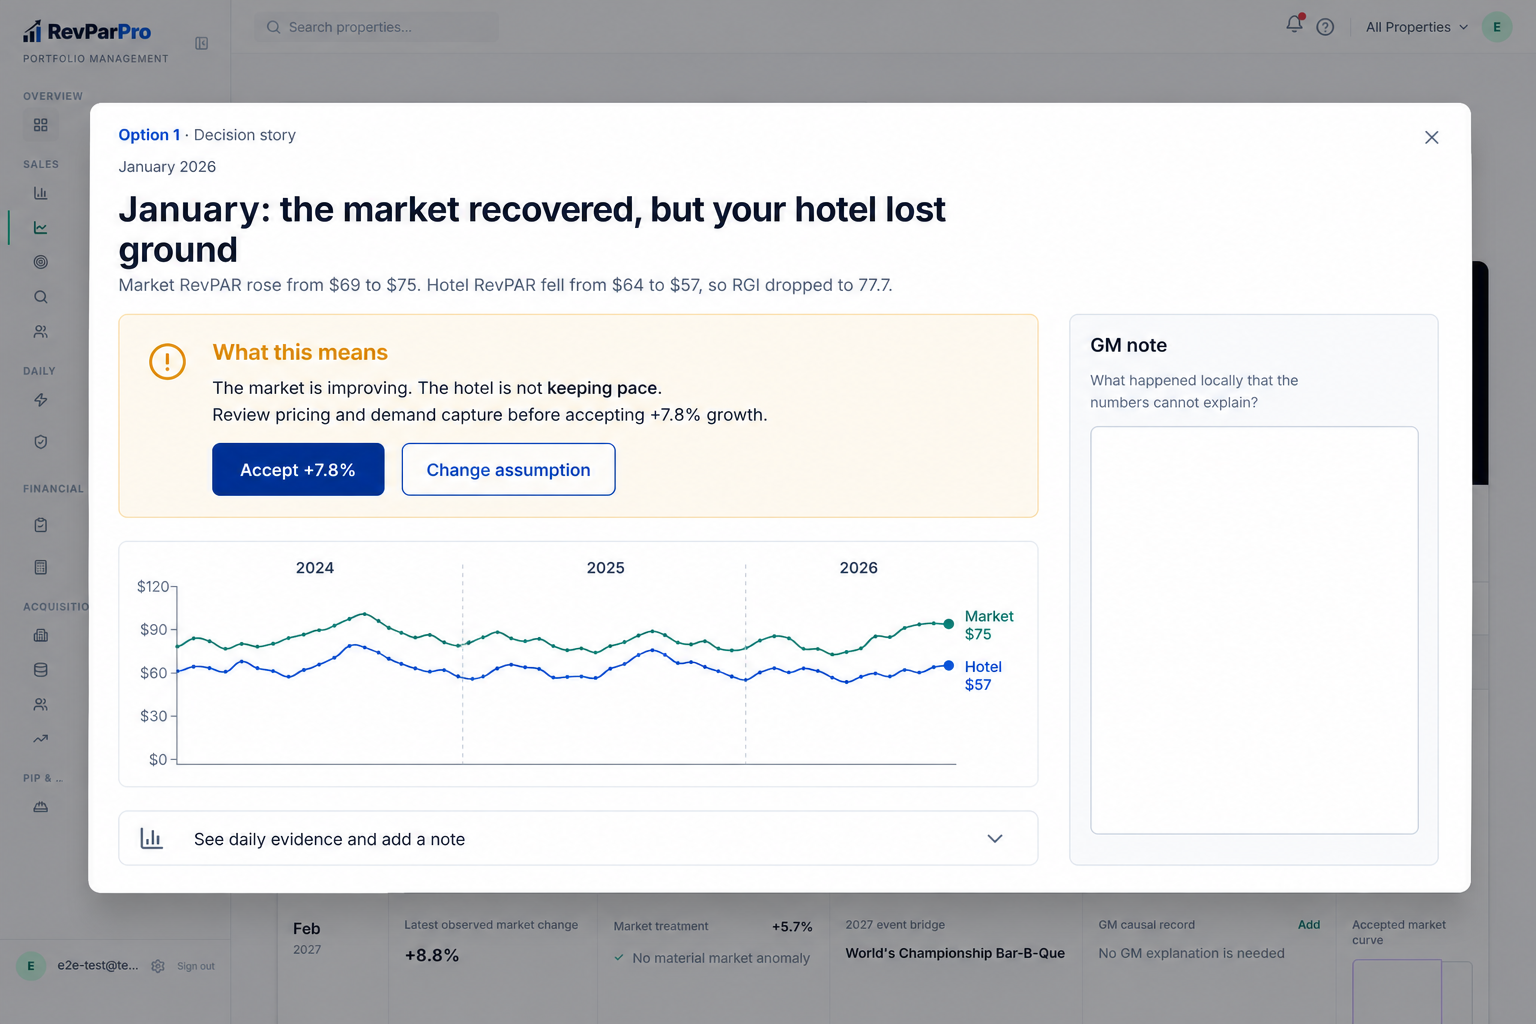
Walks through the history clearly, but still leaves the actual monthly strategy work elsewhere.
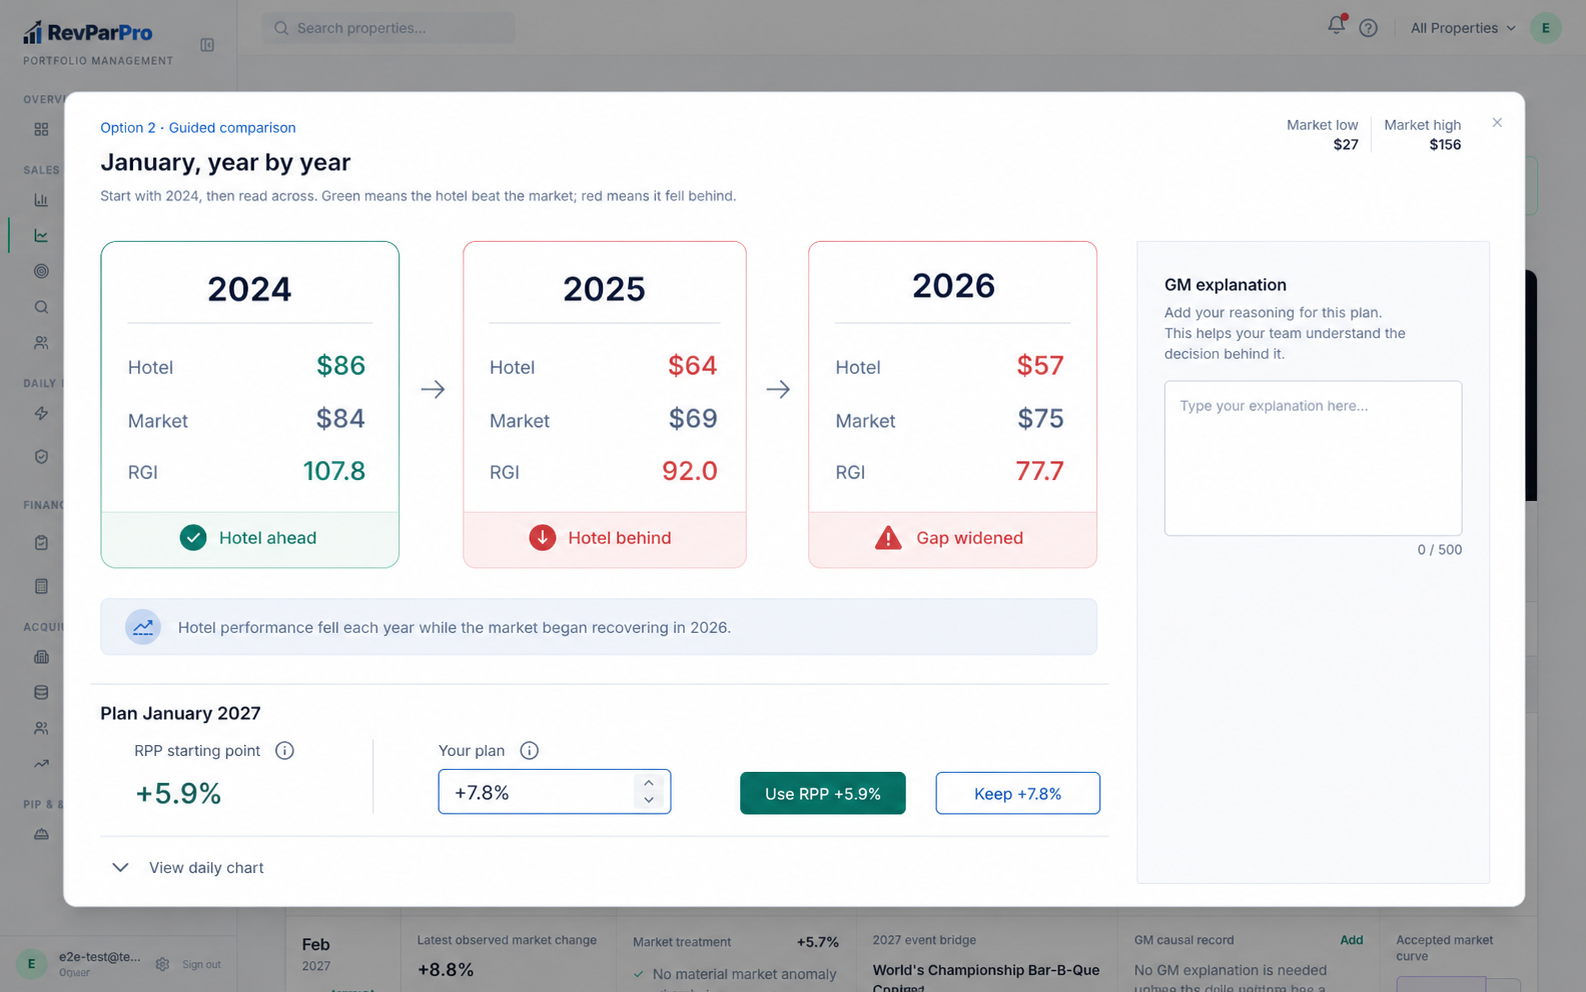
Keeps daily investigation central, but makes the chart the job instead of making the January plan.